Deciding whether to trust a carrier with your shipper's freight shouldn't require a PhD in data analysis. But for most brokerages, carrier risk assessment is a messy combination of gut instinct, a quick glance at FMCSA SAFER, and maybe a prayer.
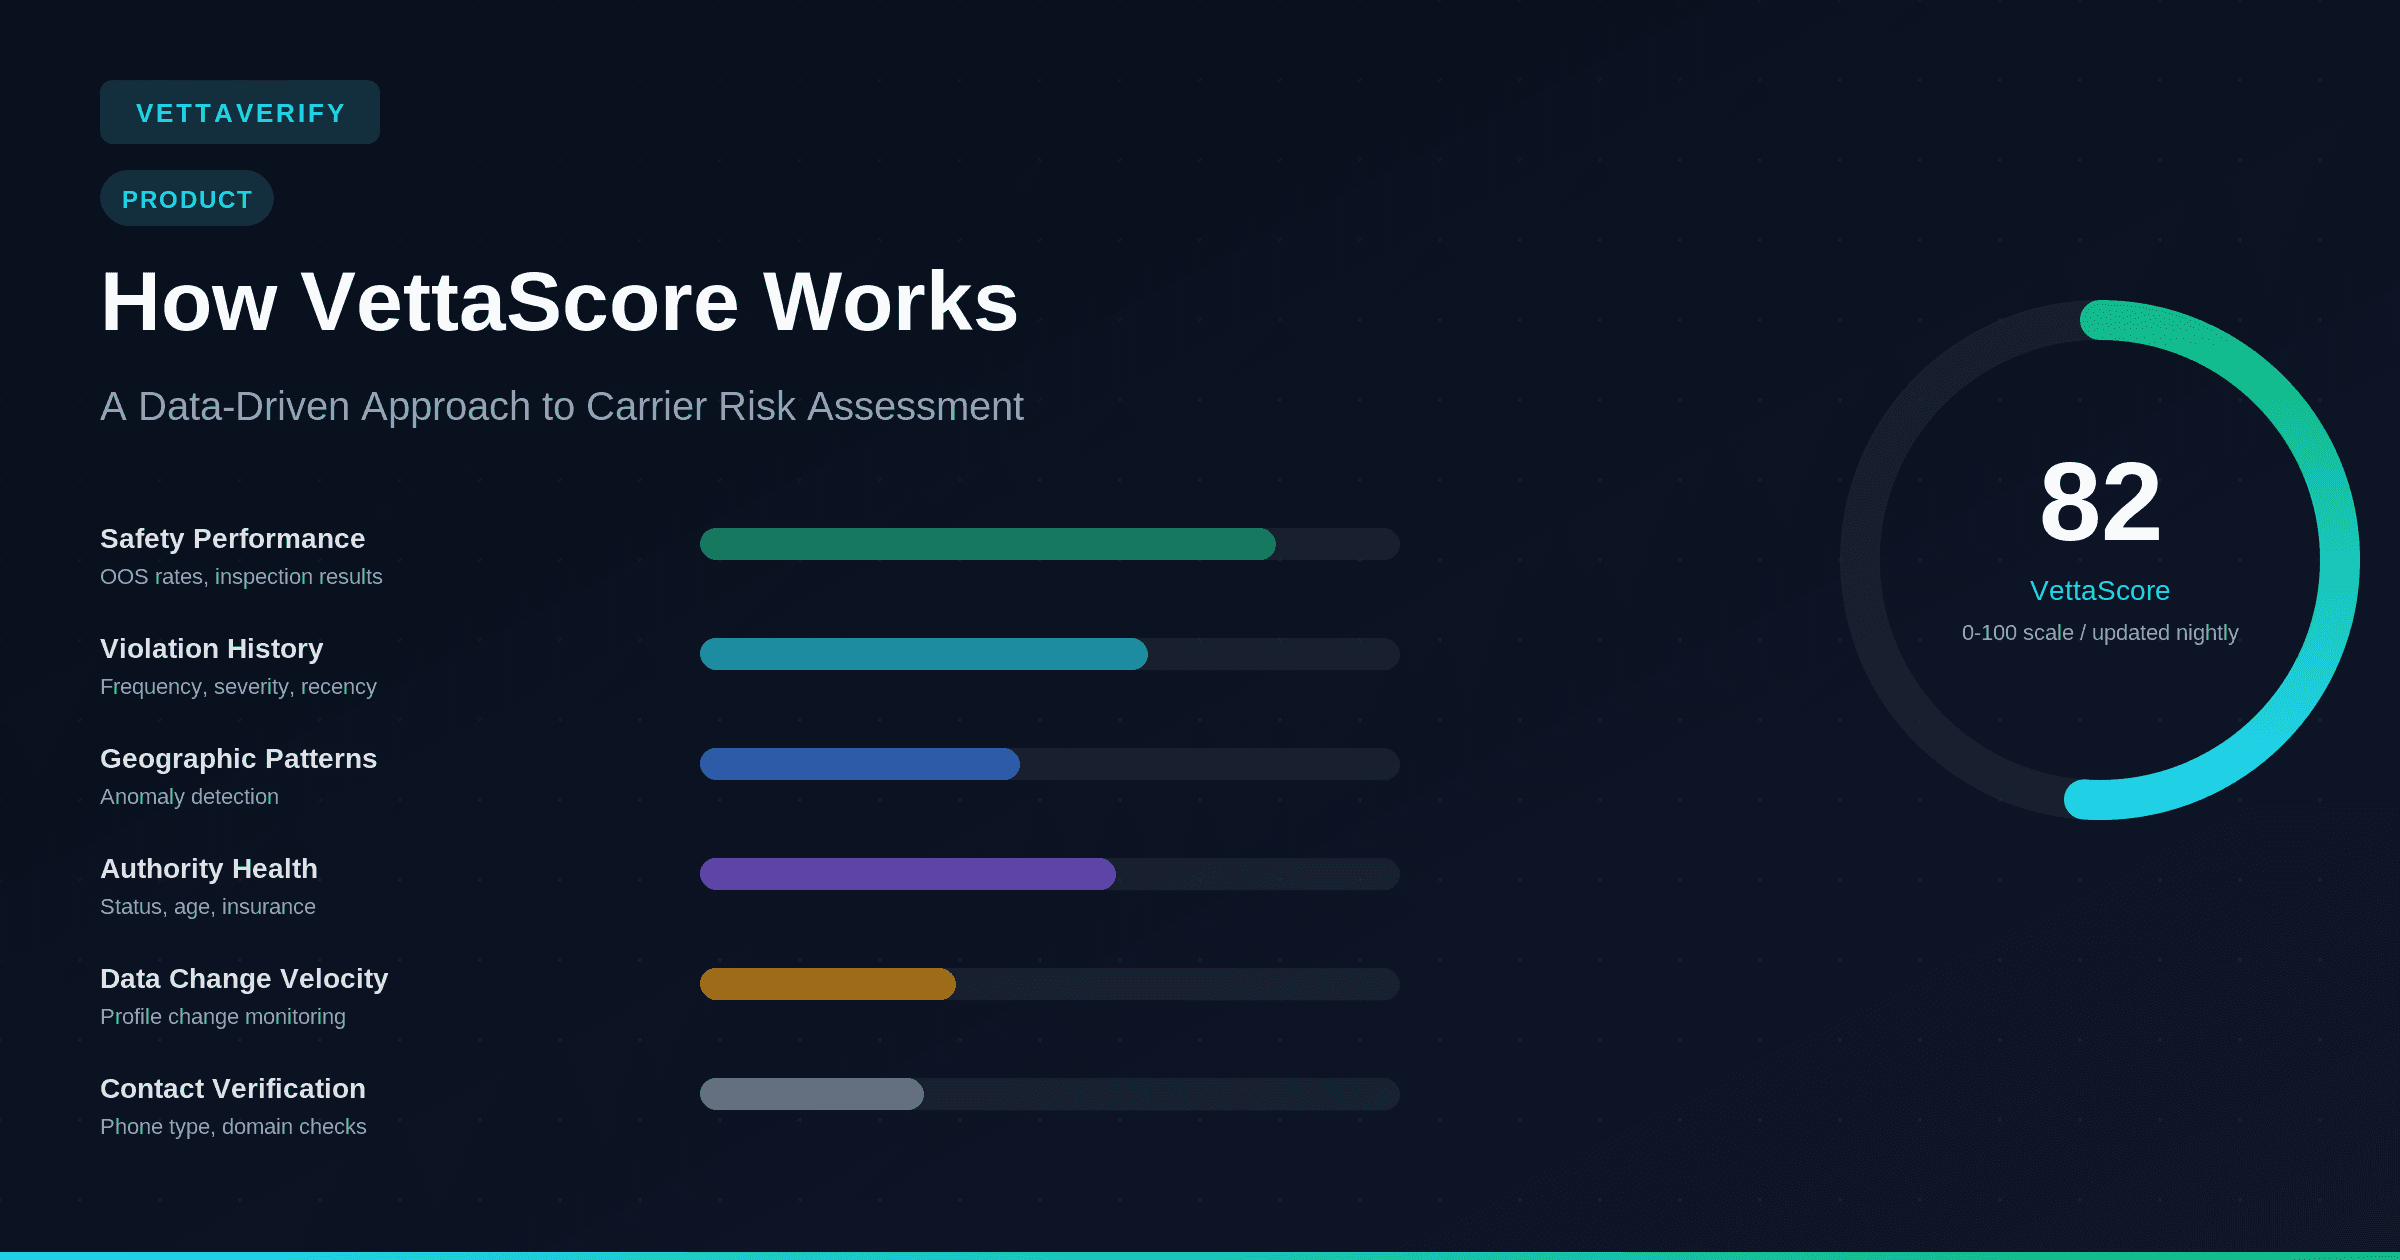
VettaScore was built to replace that guesswork with a single, easy-to-read number. Every carrier in the FMCSA database — over 2.2 million of them — gets a VettaScore between 0 and 100, updated nightly. Higher is better, and the methodology behind it is transparent.
Here's how it works.
The Problem with Raw FMCSA Data
FMCSA publishes an enormous amount of information about every registered carrier. Authority status, insurance filings, inspection results, crash data, out-of-service rates, violation history — it's all there, scattered across multiple databases and updated at different intervals.
The problem isn't access to data. It's making sense of it.
A carrier might have an active MC number and valid insurance but an out-of-service rate three times the national average. Another carrier might have a clean safety record but suspicious geographic patterns — registered in one state with all their inspections happening 2,000 miles away. A third carrier might look perfect on paper today, but their insurance is set to expire next week.
Raw data doesn't tell you what to worry about. A composite score does.
What Goes Into VettaScore
VettaScore analyzes multiple dimensions of carrier risk. Some are drawn from public FMCSA data. Others come from signals that only surface when a carrier engages directly with VettaVerify. The exact weighting is proprietary — and intentionally so. Publishing a fixed formula would give fraudsters a roadmap to game the score. Instead, VettaScore's methodology evolves continuously to stay ahead of emerging fraud tactics.
Here's what the score looks at.
Safety Performance. This is the heaviest factor in the score and the single strongest predictor of carrier reliability. VettaScore looks at out-of-service rates — how often a carrier's vehicles or drivers are taken off the road during inspections due to safety violations. A high OOS rate means the carrier's equipment or drivers are regularly failing roadside inspections, and that's a direct indicator of how well they maintain their operation.
The score examines both driver and vehicle OOS rates, benchmarks them against national averages, and weights recent data more heavily than older records. A carrier whose OOS rate is trending upward gets scored differently than one whose rate is stable or improving.
Violation History. Not all violations result in an out-of-service order, but they still matter. A carrier that racks up violations for hours-of-service cheating, brake deficiencies, or unsecured loads is signaling operational problems — even if they haven't been pulled off the road yet.
VettaScore analyzes the frequency, severity, and recency of violations. A single minor violation from two years ago barely moves the needle. A cluster of serious violations in the last six months moves it a lot.
Geographic Patterns. This component targets a specific type of fraud: chameleon carriers and identity theft operations. Legitimate carriers have inspection and operational patterns that make geographic sense. A small fleet based in Texas will have most of their inspections in Texas and neighboring states. If a carrier is registered in Georgia but all their activity is concentrated in California with no inspections in between, that's worth flagging.
Geographic pattern analysis also helps identify newly formed carriers using the identity of recently deactivated ones — a common tactic where bad actors obtain a new MC number and resume operations under a different name.
Authority Health. This component looks at the carrier's authority and compliance posture — whether their operating authority is active and in good standing, whether their insurance is current with adequate coverage, how long they've held authority, and whether they have any history of authority revocations or reinstatements.
New authority isn't automatically a red flag — every carrier starts somewhere. But new authority combined with other risk signals — unusual geography, no inspection history, recently revoked prior authority — paints a very different picture.
FMCSA Data Change Velocity. Carriers don't just have static profiles. VettaScore monitors how frequently and significantly a carrier's FMCSA data changes over time. Sudden shifts in registered address, contact information, insurance filings, or authority status can indicate instability — or something worse. A pattern of rapid changes that doesn't match normal business operations is a signal worth weighting.
Contact Verification. Not all phone numbers are created equal. VettaScore analyzes carrier contact information, including whether a carrier's primary phone number is a cellular line or a VoIP number. VoIP numbers aren't inherently suspicious — plenty of legitimate carriers use them — but in combination with other risk signals, they're a meaningful data point. Fraudsters overwhelmingly rely on disposable VoIP numbers because they're cheap, anonymous, and easy to abandon.
Carrier Engagement Signals. VettaScore doesn't just measure risk — it also recognizes carriers that go above and beyond to demonstrate trustworthiness. Carriers who complete verification steps through VettaVerify can earn score improvements that reflect their transparency.
Uploading verified certificates of insurance (COIs) demonstrates that a carrier's coverage is current and legitimate — not just a screenshot of someone else's policy. Connecting ELD data gives real-time visibility into a carrier's actual fleet operations, proving they have real trucks in real locations. These aren't mandatory, but carriers who voluntarily provide this level of transparency earn a score that reflects it.
How the Score Is Calculated
Each component generates a sub-score, which feeds into a proprietary formula to produce the final VettaScore on a 0–100 scale. The exact mix — which signals carry the most weight, how they interact, and what thresholds trigger score changes — is something we deliberately keep under wraps and continuously refine. Fraud tactics evolve, and our scoring evolves with them.
The calculation runs nightly against the latest FMCSA data. When FMCSA publishes updated census information, new inspection results, or insurance filing changes, VettaScore reflects those updates within 24 hours. Carrier engagement signals — like a newly verified COI or a fresh ELD connection — are reflected immediately.
This matters because carrier risk isn't static. A carrier that scored an 85 last month might be a 60 today if they've picked up a string of violations or had an insurance lapse. And a carrier that connects their ELD and uploads verified insurance might see their score climb. Nightly recalculation means you're always working with current data, not a stale snapshot from when the carrier was onboarded.
What the Numbers Mean
VettaScore is designed to be intuitive. As a general framework, scores above 80 indicate a carrier with strong safety performance, clean authority, consistent geographic patterns, and no major red flags. These carriers represent lower risk, though no score eliminates the need for your own judgment.
Scores between 60 and 80 suggest a carrier that's generally acceptable but may have some areas worth reviewing — perhaps an above-average OOS rate, a few recent violations, or relatively new authority. These carriers aren't necessarily bad, but they warrant a closer look at the underlying data before you make a decision.
Scores below 60 indicate elevated risk. The carrier may have serious safety performance issues, suspicious geographic patterns, authority problems, or some combination. Carriers in this range deserve careful scrutiny, and in many cases, your vetting criteria should automatically flag or reject them.
Scores below 30 represent significant risk and are often associated with carriers that have major safety deficiencies, revoked or problematic authority history, or patterns consistent with fraud.
What VettaScore Doesn't Do
Transparency means being honest about limitations. VettaScore is a risk indicator, not a verdict.
It doesn't capture everything about a carrier. Factors like on-time delivery performance, communication quality, cargo handling care, and driver professionalism aren't reflected in FMCSA data and therefore aren't in the score. A carrier with a high VettaScore could still be terrible to work with operationally. A carrier with a moderate score might be excellent in ways the data doesn't capture.
VettaScore also doesn't replace your judgment or your brokerage's specific risk tolerance. A carrier with a 65 might be perfectly acceptable for a low-value, low-risk lane but inappropriate for a high-value, time-sensitive shipment. The score gives you a starting point — your criteria and context provide the rest.
How Brokerages Use VettaScore in Practice
The most common workflow is brokerages setting a minimum VettaScore threshold as part of their vetting criteria. For example, a brokerage might set a policy that any carrier below 50 is automatically flagged for manual review, while carriers above 75 can proceed through an expedited vetting process.
This creates a tiered approach: low-risk carriers move through quickly (reducing onboarding friction and time-to-book), moderate-risk carriers get appropriate scrutiny, and high-risk carriers are caught before they ever touch a load.
VettaScore also powers the monitoring workflow. When a carrier in your network sees their score drop — because of new violations, an insurance change, or an authority issue — that change surfaces as an alert. Instead of manually re-checking every carrier periodically, you focus your attention where the data says it matters.
The Philosophy Behind the Score
There's a tension in building a risk score: transparency builds trust, but too much transparency hands fraudsters a playbook. We've tried to strike the right balance.
The factors that go into VettaScore are public — you're reading about them right now. The underlying data for any individual carrier is visible in their profile, so you can always see what's driving a score up or down. But the exact formula — how these factors are weighted, how they interact, and what specific thresholds we use — is proprietary and continuously evolving.
This isn't secrecy for its own sake. Fraud in the freight industry is an arms race. The moment a scoring methodology becomes fully predictable, bad actors optimize around it. By keeping the precise mix confidential and updating it as new fraud patterns emerge, VettaScore stays a moving target for the people trying to game it — and a reliable signal for the brokers relying on it.
Every VettaScore is backed by the underlying data that produced it. You can see the specific factors influencing a carrier's score, identify which components are pulling it up or down, and make your own informed assessment. The score is a starting point for investigation, not a replacement for it.
Carrier vetting is ultimately about managing risk with limited time and information. VettaScore compresses a complex, multi-dimensional data problem into a single number you can act on — while keeping the full detail available when you need to dig deeper.
For more on how carrier risk translates to real-world fraud, see the real cost of not vetting carriers and our guide to detecting double brokering red flags.
That's what data-driven vetting looks like in practice: not a magic answer, but a much better starting point.